
Almost everyone with an R package in CRAN wonders how often it’s installed and used. Two years ago RStudio kindly started offering anonymized logs of their downloads from their CRAN mirror, which allows one to graph the number of downloads over time. Much easier than downloading and processing all of the log files, however, is working with RStudio’s JSON API, (which can be accessed with cranlogs) to find downloads-per-day statistics for any specific package.
To make plotting a package’s downloads even easier, I’ve used that API to create a Shiny app! Simply type in any package in CRAN, select the amount of time you want to graph over, and voila:
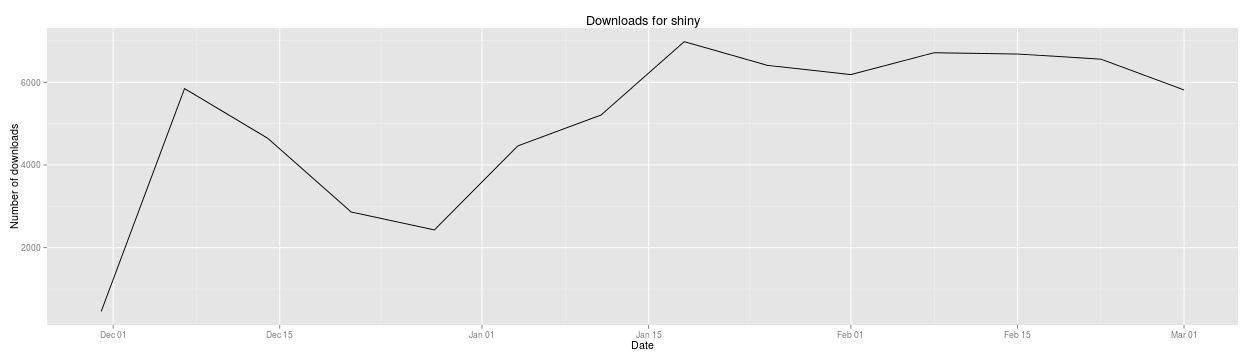
You can find the code for the app here. Enjoy!