There’s no end of interesting data analyses that can be performed with Stack Overflow and the Stack Exchange network of Q&A sites. Earlier this week I posted a Shiny app that visualizes the personalized prediction data from their machine learning system, Providence. I’ve also looked at whether high-reputation users were decreasing their answering activity over time, using data from the Stack Exchange Data Explorer.
One issue is that each of these approaches requires working outside of R to obtain the data (in the case of the Data Explorer, it also requires knowledge of SQL). I’ve thus created the stackr package, which can query the Stack Exchange API to obtain information on questions, answers, users, tags, etc, and converts the output into an R data frame that can easily be manipulated, analyzed, and visualized. (Hadley Wickham’s httr package, along his terrific guide for writing an API package, helped a lot!) stackr provides the tools to perform analyses of a particular user, of recently asked questions, of a particular tag, or of other facets of the site.
The package is straightforward to use. Every function starts with stack_: stack_answers to query answers, stack_questions for questions, stack_users, stack_tags, and so on. Each output is a data frame, where each row represents one object (an answer, question, user, etc). The package also provides features for sorting and filtering results in the API: almost all the features available in the API itself. Since the API has an upper limit of returning 100 results at a time, the package also handles pagination so you can get as many results as you need.
Example: answering activity
Here I’ll show an example of using the stackr package to analyze an individual user. We’ll pick one at random: eeny, meeny, miny… me. (OK, that might not have been random). Stack Overflow provides many summaries and analyses on that profile already, but the stackr package lets us bring the data seamlessly into R so we can analyze it however we want. Extracting all of my answers is done using the stack_users function with the extra argument "answers". We’ll take advantage of stackr’s pagination feature, and turn the result into a tbl_df from dplyr so that it prints more reasonably:
library(stackr)
library(dplyr)
answers <- stack_users(712603, "answers", num_pages = 10, pagesize = 100)
answers <- tbl_df(answers)
answers
## Source: local data frame [732 x 14]
##
## owner_reputation owner_user_id owner_user_type owner_accept_rate
## 1 34279 712603 registered 100
## 2 34279 712603 registered 100
## 3 34279 712603 registered 100
## 4 34279 712603 registered 100
## 5 34279 712603 registered 100
## 6 34279 712603 registered 100
## 7 34279 712603 registered 100
## 8 34279 712603 registered 100
## 9 34279 712603 registered 100
## 10 34279 712603 registered 100
## .. ... ... ... ...
## Variables not shown: owner_profile_image (chr), owner_display_name (chr),
## owner_link (chr), is_accepted (lgl), score (int), last_activity_date
## (time), last_edit_date (time), creation_date (time), answer_id (int),
## question_id (int)This lets me find out a lot about myself: for starters, that I’ve answered 732 questions. What percentage of my answers were accepted by the asker?
mean(answers$is_accepted)## [1] 0.6297814And what is the distribution of scores my answers have received?
library(ggplot2)
ggplot(answers, aes(score)) + geom_histogram(binwidth = 1)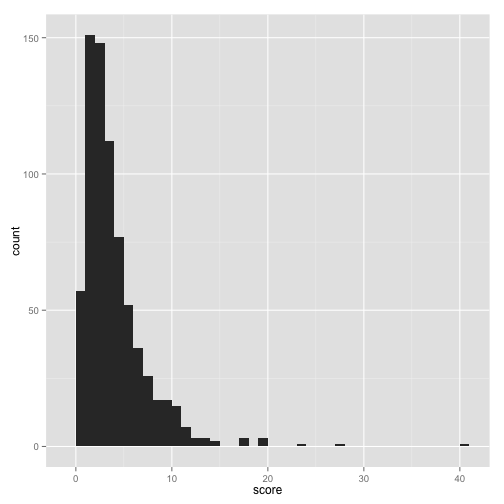
How has my answering activity changed over time? To find this out, I can use dplyr to count the number of answers per month and graph it:
library(lubridate)

answers %>% mutate(month = round_date(creation_date, "month")) %>%
    count(month) %>%
    ggplot(aes(month, n)) + geom_line()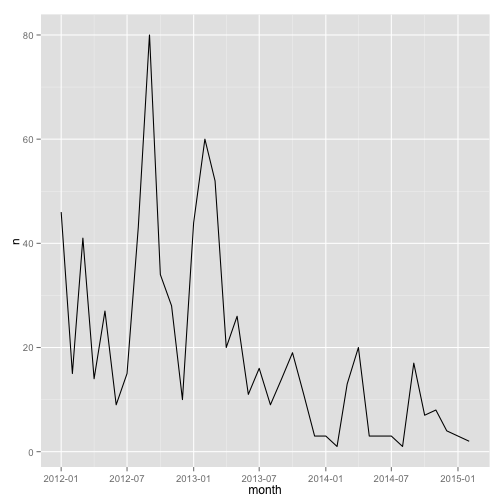
Well, it looks like my activity has been decreasing over time (though I already knew that). How about how my answering activity changes over the course of a day?
answers %>% mutate(hour = hour(creation_date)) %>%
    count(hour) %>%
    ggplot(aes(hour, n)) + geom_line()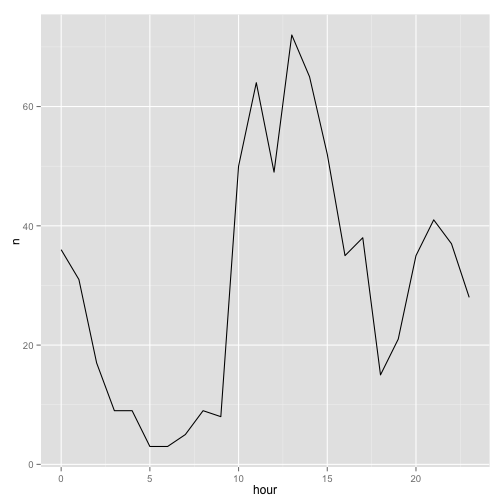
(Note that the times are in my own time zone, EST). Unsurprisingly, I answer more during the day than at night, but I’ve still done some answering even around 4-6 AM. You can also spot two conspicuous dips: one at 12 when I eat lunch, and one at 6 when I take the train home from work.
(If that’s not enough invasion of my privacy, you could look at my commenting activity with stack_users(712603, "comments", ...), but it generally shows the same trends).
Top tags
The API also makes it easy to extract the tags I’ve most answered, which is another handy way to extract and visualize information about my answering activity:
top_tags <- stack_users(712603, "top-answer-tags", pagesize = 100)
head(top_tags)
## user_id answer_count answer_score question_count question_score
## 1 712603 463 1604 1 7
## 2 712603 234 812 6 32
## 3 712603 52 187 0 0
## 4 712603 26 127 1 7
## 5 712603 34 110 1 9
## 6 712603 26 104 0 0
## tag_name
## 1 python
## 2 r
## 3 list
## 4 python-2.7
## 5 django
## 6 stringtop_tags %>% mutate(tag_name = reorder(tag_name, -answer_score)) %>%
head(20) %>%
ggplot(aes(tag_name, answer_score)) + geom_bar(stat = "identity") +
theme(axis.text.x = element_text(angle = 90, hjust = 1))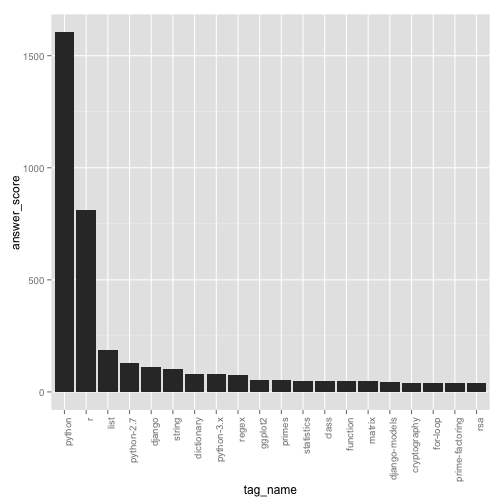
We could also view it using the wordcloud package:
library(wordcloud)
wordcloud(top_tags$tag_name, top_tags$answer_count)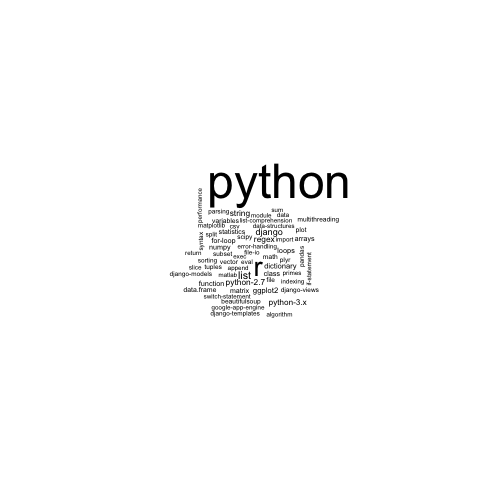
This is just scratching the surface of the information that the API can retrieve. Hopefully the stackr package will make possible other analyses, visualizations, and Shiny apps that help understand and interpret Stack Exchange data.
