
A few years ago, I wrote a post Don’t teach built-in plotting to beginners (teach ggplot2). I argued that ggplot2 was not an advanced approach meant for experts, but rather a suitable introduction to data visualization.
Many teachers suggest I’m overestimating their students: “No, see, my students are beginners…”. If I push the point, they might insist I’m not understanding just how much of a beginner these students are, and emphasize they’re looking to keep it simple and teach the basics, and that that students can get to the advanced methods later….
My claim is that this is precisely backwards. ggplot2 is easier to teach beginners, not harder, and makes constructing plots simpler, not more complicated.
I’ve continued making this argument in the years since, and I like to think our side is “winning.” Even people that defend teaching base R plotting often treat it as an “underdog” opinion, which you never would have seen just a few years ago.
There’s another debate that has popped up recently on Twitter and in conversations (many this week at the useR conference), about how to teach general R programming and data manipulation, and about the role of the “tidyverse” in such education. Just like ggplot2, this is a subject close to my heart.
When @hspter challenges me to rant about tidyverse vs base #rstats pic.twitter.com/p9uV6dLS3z
— David Robinson (@drob) March 20, 2017
I’d summarize the two “competing” curricula as follows:
- Base R first: teach syntax such as
$and[[]], loops and conditionals, data types (numeric, character, data frame, matrix), and built-in functions likeaveandtapply. Possibly follow up by introducing dplyr or data.table as alternatives. - Tidyverse first: Start from scratch with the dplyr package for manipulating a data frame, and introduce others like ggplot2, tidyr and purrr shortly afterwards. Introduce the
%>%operator from magrittr immediately, but skip syntax like[[]]and$or leave them for late in the course. Keep a single-minded focus on data frames.
I’ve come to strongly prefer the “tidyverse first” educational approach. This isn’t a trivial decision, and this post is my attempt to summarize my opinions and arguments for this position. Overall, they mirror my opinions about ggplot2: packages like dplyr and tidyr are not “advanced”; they’re suitable as a first introduction to R.1
(Note that here I’m focusing on the reasons for teaching the tidyverse first, not the arguments for using it at all. If you dislike packages like dplyr and/or the %>% operator, this post isn’t for you and you won’t be convinced).
Get students doing powerful things quickly
Most of my educational philosophy can be boiled down to this statement: have goals for what your students should be able to do, and start them doing it as soon as possible. In the case of data science classes2, those goals are probably something like:
- Work with real and interesting data
- Create appealing and informative visualizations
- Draw useful conclusions
These should be goals for the first lesson, not something you get to in a bonus exercise or on the last day. And when you’re using powerful and flexible tools like dplyr and tidyr, it’s entirely possible.
Here’s an example. When I taught R to biology students, I used an approach like the one in this series of posts, cleaning and then visualizing a gene expression dataset.
library(tidyverse)

url <- "http://varianceexplained.org/files/Brauer2008_DataSet1.tds"

# Clean and tidy the data
cleaned_data <- read_delim(url, delim = "\t") %>%
  separate(NAME, c("name", "BP", "MF", "systematic_name", "number"), sep = "\\|\\|") %>%
  mutate_at(vars(name:systematic_name), funs(trimws)) %>%
  select(-number, -GID, -YORF, -GWEIGHT) %>%
  gather(sample, expression, G0.05:U0.3) %>%
  separate(sample, c("nutrient", "rate"), sep = 1, convert = TRUE) %>%
  filter(!is.na(expression), systematic_name != "")

# Visualize a set of four genes
cleaned_data %>%
  filter(BP == "leucine biosynthesis") %>%
  ggplot(aes(rate, expression, color = nutrient)) +
  geom_point() +
  geom_smooth(method = "lm", se = FALSE) +
  facet_wrap(~name + systematic_name)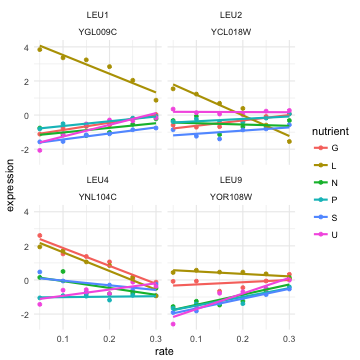
From experience, I promise that students who have never programmed before can complete and understand the above code in a 2-3 hour workshop, by learning each function one at a time.
Some advantages of this kind of approach:
- Every step solves an immediate problem. You don’t need to promise your students “this will be useful one day”, you’re showing them how it’s useful right now. Each step in the data processing makes the data more usable, and each step in the visualization describes an aspect of a biologically informative graph.
- Every step teaches a function that can be used on a variety of datasets. This works because dplyr/tidyr (like ggplot2) offers atomic verbs (e.g.
filter) rather than ones specific to a particular field (e.g.process_yeast_data). - It gives a taste of real exploratory data analysis. There’s some practical wisdom to be gained from even a simple example like this. One is that any dataset found “in the wild” requires steps of cleaning and processing (here, using functions like
separate,mutate,gather, andfilter). Another is that you can’t interpret thousands of yeast genes all at once, but you can zoom in on a few genes at a time, such as those involved in an interesting biological process.
Biology isn’t a special case (to the contrary, I’ve heard it put forward as an exception: “tidy data might work in other fields, but not in biology”). Every Friday for the last nine months I’ve held “workshops” with a group of developers at Stack Overflow who are learning R and data science, and we’ve had a great time performing exploratory analysis drawn from our company’s internal data (see here for more). Questions have included what programming languages are growing or shrinking, or how people apply to software developer jobs. The developers in the workshop were new to R when they started, but were immediately able to solve real problems using tidy tools.
Don’t teach procedural logic (loops and conditionals), teach tables (group by and join)
One of the more controversial aspects of the “tidyverse first” philosophy is that it doesn’t teach loops or conditional statements (for, if, etc) at all, or leaves them until late in the course.
One reason I support this choice is that most loops beginners need are easily replaced with functionals, such as map or group_by/summarize.
When you start writing a loop then turn it into dplyr#rstats pic.twitter.com/M0gXUXuYCP
— David Robinson (@drob) February 22, 2016
Secondly, beginners notoriously misuse loops in R. If you get students into the habit of using loops to solve problems, they won’t notice vectorized solutions.
# you want students to do this
y <- x + 1

# never this
y <- c()
for (e in x) {
  y <- c(y, e + 1)
}
Besides loops being more cumbersome, they can be disastrously slow if used improperly. And teaching beginners how to make a loop efficient (e.g. pre-allocating memory rather than growing a vector) is an advanced topic that would send an introductory course off track.
Some teachers have argued that while teaching loops may not be the most effective way to use R, it at least transfers to other programming languages. This claim has some merit, but it’s missing an advantage of the dplyr approach, which also teaching relevant programming constructs: group by and join. I’d suggest these are actually more important skills for data scientists (who are more likely to use SQL on a daily basis than C), and ones that are more often overlooked in programming education.
Loops and conditions are of course necessary: I use them all the time when developing R packages. But they’re typically used in cases that involve processing unknown input (you wouldn’t use a conditional when you’re analyzing one dataset) or are implementing more complicated algorithms like expectation-maximization. From the perspective of a data science course, that makes these advanced features: you shouldn’t teach them until you’re confident your students will need them. Once students are comfortable with the basics of data analysis, they’ll have plenty of time to learn these tools.
%>% isn’t too hard for beginners
The %>% operator, introduced in the magrittr package by Stefan Milton Bache, is an important part of the tidyverse philosophy. I’ve heard a lot of resistance about teaching it: “I like %>%, but I’m not teaching it to my students because I don’t want to confuse them.”
I disagree with this approach, but not because %>% syntax isn’t confusing for non-programmers. I diagree because all programming syntax is confusing for non-programmers. This is easy to forget when you’ve had a lot of programming experience yourself.
When teaching, be careful not to mix up "I learned this a long time ago" with "This is simple"#rstats
— David Robinson (@drob) April 20, 2016
Try working with someone who has never coded before, and teaching them that f(a, b) means to jump to another part of your code, or try explaining the mathematical impossibility of x = x + 1. Think about every parenthesis, comma and bracket in your code, and how they’d look to a beginner. These are second nature to programmers, but there’s nothing inherently “easy” about them.
In fact, I’d say that %>% is above average in terms of syntax interpretability. It’s designed to make code more linear and readable. (Look at the above bioinformatics code: doesn’t it read a bit like a Methods section?)
There’s only one way to do it
A motto of the Perl programming language is “There’s more than one way to do it”, meaning that the language offers many options for programmers when they approach their problems. The Zen of Python took the opposite approach: “There should be one— and preferably only one— obvious way to do it.” I’ve come to prefer the latter, especially as a teaching philosophy, and the tidyverse is nicely compatible with this approach.
A few years ago I taught an introductory class on data visualization, as a series of three lectures. I decided to teach ggplot2 in my second lecture, but focus on variables and data structures in the first. An example lesson from the first lecture was to show three ways that a column in a data frame could be manipulated, something like:
mtcars$pounds <- mt$wt * 1000
mtcars[["pounds"]] <- mtcars[["wt"]] / 1000
mtcars[, "pounds"] <- mtcars[, "wt"] / 1000
Looking back I have no idea what I was thinking! Someone new to R doesn’t need three ways to access a column in a data frame, nor will they remember them after a brief demonstration.
Now I say “when you’re adding a column or changing an existing column, use the mutate() verb”:
mtcars <- mtcars %>%
  mutate(pounds = wt / 1000)
Whether this is “better” or “worse” than the above syntax misses the point. To students, what matters is consistency. And besides teaching only one approach to accessing columns, mutate() has the advantage of being consistent with other %>%-compatible methods, some of which do more complicated tasks than just adding a column.
This is also why I’m not a fan of the approach “teach base first, then show how much simpler the dplyr approach is.” Teaching students two ways will always confuse them, even if you present it as a “progression”. Besides which, students don’t share your nostalgia- there is no need to convince them to switch “away” from something they never used.
What from base R should be taught, and when?
Of course it’s important to teach elements of base R programming; you can’t use R without them. The question is entirely about order and priority. I like to follow this rule: introduce aspects of base R alongside the tidyverse as they become useful in a data analysis.
Examples of aspects of base R and when to introduce them include:
- Summary functions:
mean(),sd(),max(). These can be introduced alongsidesummarizevery early in the course, to answer specific questions about a dataset. - Vectorized operations: Basic arithmetic, logical operators (
x == 2,mean(x == 2)),%in%, etc. These also become necessary early on, particularly in data cleaning operations. - Statistical modeling:
lm(),glm(),t.test(), etc. Statistical operations are what what make R a great language. These pair well with my broom package for converting models to tidy data frames, so that they can be used with other tidyverse tools. - Matrices: This is a tougher decision. Matrices solve a different set of problems than data frames do, and are represented by different mathematical language (linear algebra rather than relational algebra). I think that when you teach matrices, it shouldn’t just be because it’s another data type on a checklist, but because you’re presenting a problem matrices are well suited to solve (principal component analysis, clustering, etc).3 In a mathematically oriented course (as opposed to a data science one), this unit would likely come before one on data frames and have a greater emphasis.
I followed a curriculum like this in my DataCamp course (you can take the first chapter for free). The first chapter, for example, introduces %>% and several dplyr functions (filter/mutate/select/group_by/summarize/arrange), but also variable assignment, logical operators, %in%, and mean(x == 1). In the third chapter, I introduced lm alongside the broom and purrr packages.
I’m not saying this is the best possible R curriculum or the one you should follow, but it demonstrates the approach I’d recommend. Pairing each base R lesson with a problem it solves keeps the class interesting, and gives students the ability to apply the lessons in the future.
Conclusion: You have permission not to be boring
I’ve made an awful lot of mistakes when I’ve taught R. (In one 2012 assignment I suggested that “advanced students” could use ggplot2 for extra credit. What was I thinking?!). If I had to describe my most common mistake, it would be something like:
- Programming is hard, therefore…
- People will need to learn some boring material, therefore…
- I should get boring material “out of the way” first
To a teacher, starting with boring material feels like a safe choice, because we associate boring material with what’s necessary and reliable.
If there’s one piece of advice I wish I could communicate to my past self, it’s “You have permission not to be boring.” Something being boring doesn’t make it necessary: often material is boring because it’s not solving a problem the students have. Something being boring doesn’t make it reliable, either. If students forget what you taught them, they can’t be relied upon to use it well.
In time, students will learn the “boring” material when they need to, during the thousands of hours it takes to become a proficient programmer. An introductory course has a different and important responsibility: to convince people that R is worth learning. And tidyverse packages are a powerful tool towards that goal.
-
Note that this post applies equally well to the data.table package, which also supports group-by thinking and gives students powerful options quickly. I personally prefer teaching dplyr (I find the syntax simpler), but it’s not a strong opinion, and I’ve taught data.table to beginners before). ↩
-
Note that these goals would be different in programming classes that aren’t about analyzing data. But the philosophy still holds: if you were teaching a course on web development, you should get students to make a simple website on the first day, not spend the first six weeks talking about variable types in Javascript. ↩
-
It’s also worth noting that you can skip over some matrix operations with my widyr package, rather than converting a data frame into a matrix, performing an operation, and turning the result back into a data frame. This wouldn’t be the right approach in mathematical education, but it’s useful in exploratory analysis. ↩