
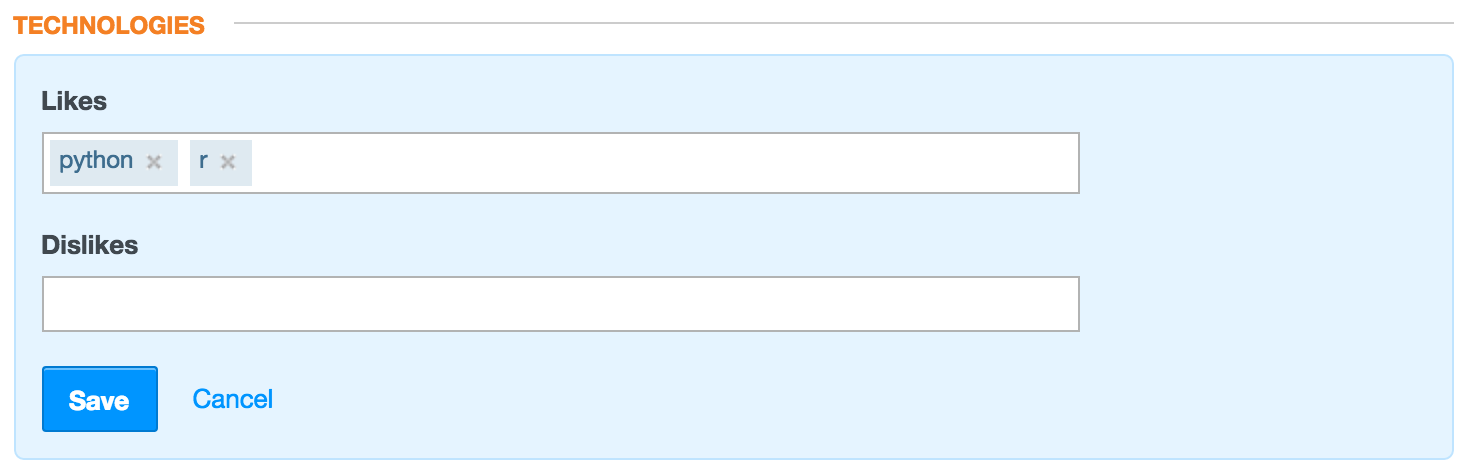
Users on Stack Overflow Careers, our site for matching developers with jobs, can create customized profiles (“CVs”) to show to prospective employers. As part of these profiles, they have the option of specifying specific technologies they like or dislike.
This produces an interesting and unusual opportunity for our data team to analyze the opinions of over 150,000 developers. There are many ways to measure the popularity of a language (# of Stack Overflow questions, GitHub repositories, Google searches, etc- see here, for example). But this dataset is a rare way to find out what technologies people tend to dislike, when given the opportunity to talk about them.
Popular and polarizing technologies
Let’s start by looking at the 25 most mentioned technologies. As a measure of how polarizing each tag is, we’ll look at what fraction of the time it is placed in Disliked Tags (as opposed to Liked Tags). Thus, .5 would mean a tag was disliked as often as it was liked.
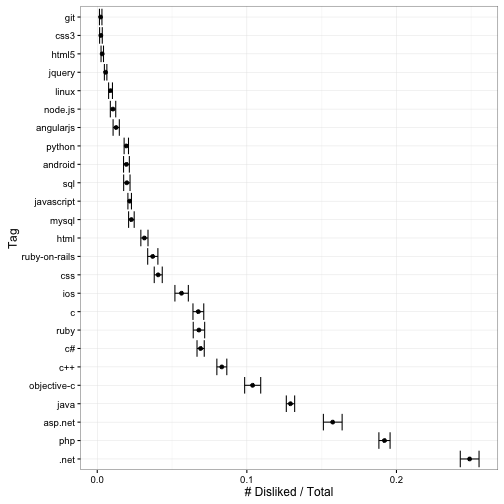
(Note that I use the method I describe in this post to estimate these averages, and this method to calculate the 95% intervals).
A lot of newer web technologies (CSS3, HTML5, JQuery) are highly liked and rarely disliked, as is the Linux operating system. Languages like PHP, Java, and the .NET framework are the most polarizing.
What are the most disliked technologies- in particular, the ones disliked more often than they are liked? Here I limited them to technologies mentioned at least 200 times.
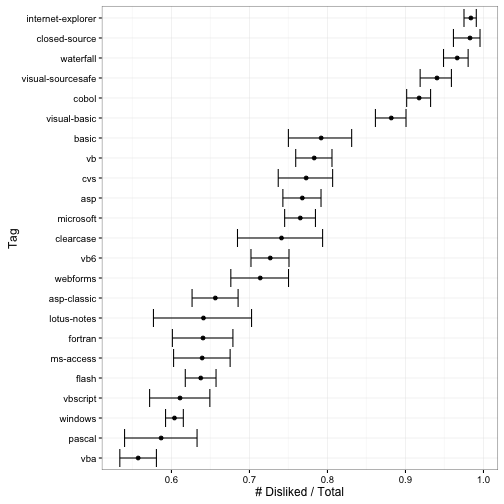
The vast majority are Microsoft technologies, such as Internet Explorer, Visual Basic, and ASP. Others include tags associated with enterprise development (‘closed-source’, ‘waterfall’), and older languages such as COBOL, Fortran and Pascal. It’s worth emphasizing that this is no indictment of the technologies, their quality, or their popularity. It is simply a measurement of what technologies stir up strong negative feelings in at least a subset of developers.
We could also zoom in on the most uniformly popular technologies, those that are almost never disliked (this time looking only at technologies mentioned > 2000 times).
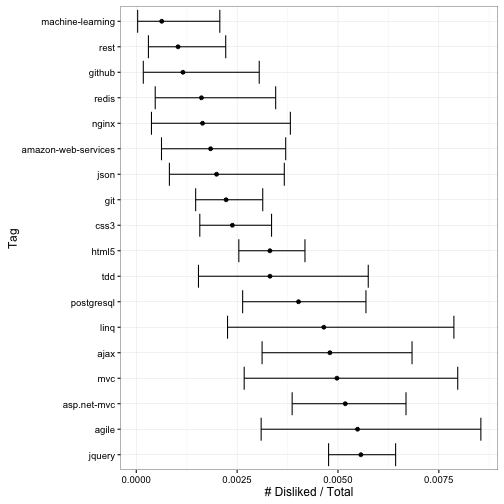
Data scientists come off well: machine-learning was liked 2075 times, but disliked only once. Other popular tags are not too surprising (can you imagine someone saying “I hate test-driven development” on a job profile?). And of course, jQuery is as popular as ever on Stack Overflow.
Tags associated with polarized people
Some people put down no disliked tags. Many put between 1-5, and a very few put more than 10. There is therefore a spectrum of “less polarized” people, who don’t share any tags they dislike, to openly polarized people who do.
One question I had is whether we could predict how many tags someone disliked, and thus how “polarized” their opinions are, based on which tags they liked. This is not meant to “call out” any community. There is nothing wrong with someone sharing that they prefer not to develop in a technology. But it would be interesting to see whether the dislike of some technologies seen above comes from particular groups of developers.
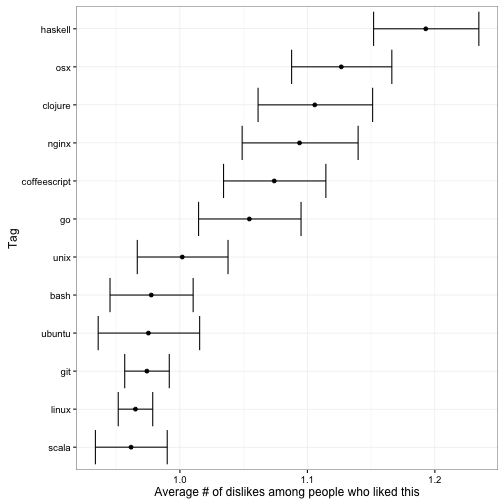
I considered the average number of dislikes among people who liked each tag. Which “Liked” tags were associated with people who most “Disliked” other tags?
(Mathematical sidenote: I used a variation of the empirical Bayes method from above to estimate these- one that works on counts rather than proportions).
What distinguishes these tags? Two noteworthy trends:
- Several are relatively new languages (‘coffeescript’, ‘go’), functional languages (‘haskell’), or both (‘clojure’, ‘scala’). Examining these groups further showed these groups tended to dislike the ‘php’ and ‘java’ tags.
- Many are associated with non-Windows operating systems (‘osx’, ‘unix’, ‘ubuntu’, ‘bash’, ‘linux’). These users overwhelmingly tended to dislike the ‘windows’ tag.
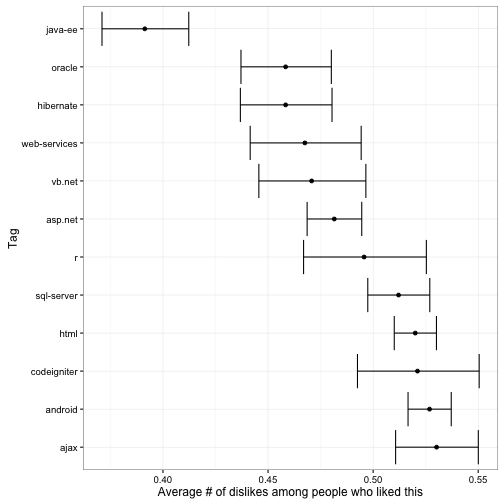
I also examined which tags were associated with the least polarized people, though less of a pattern emerged.
Conclusion
There’s a lot more data than I was able to explore here, and a lot more questions that can be answered. You can download the (anonymized) data and code here to try your own analysis. (For instance, while it didn’t appear on these graphs, you can see that the R language is quite uniformly liked!)
I don’t have any interest in “language wars”, and I don’t have any judgment of users who share technologies they’d rather not work with. But thinking about how polarizing Microsoft technologies are does encourage me to share my personal side. I’ve been a lifelong Mac and UNIX user, and nearly all of my programming in college and graduate school was centered around Python and R. But I was happy to join a company with a .NET stack, and I’m glad I did- because I loved the team, the product, and the data. I can’t speak for anyone else, but I’m glad I defined myself in terms of what work I wanted to do, and not something I wanted to avoid.